Making Full Use of Standardized Employee Satisfaction Surveys
- Staff
- Oct 8, 2024
- 4 min read
Updated: Oct 8, 2024
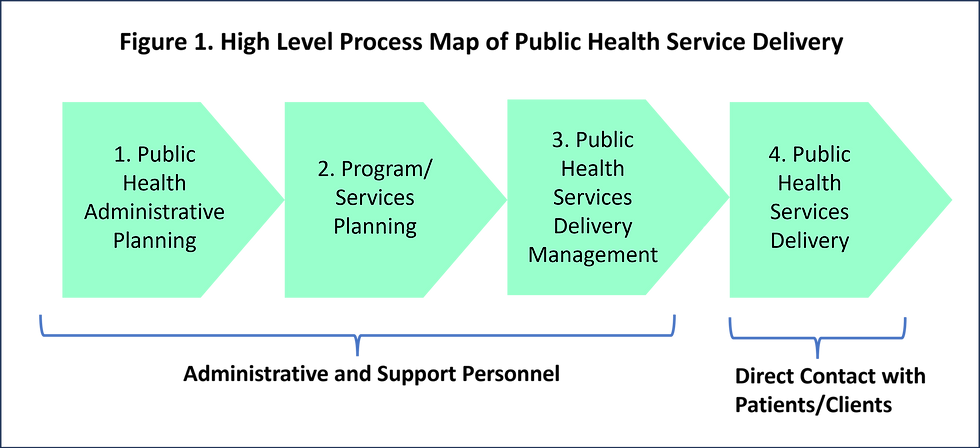
For social service delivery agencies, a client satisfaction survey involves listening to the voice-of-customers. Similarly, a standardized employee survey involves hearing the voice-of-process. Full-service employee input surveys can be prohibitively expensive for most non-profits. A standardized employee survey can cost a 200-employee public health service delivery agency like that in Figure 1 in the range of $30,000. Providers of this survey justify its value in the capability for inter-agency performance comparisons as well as reduced costs and time spent in its design, planning, distribution and analysis (6). Often, the claimed value is not realized as management information derived from the results is highly condensed with bar graphs, pie-charts and a simple summary such as that in Table 1.

A well-performing service delivery agency effectively motivates its employees deliver exceptional quality to clients (1)(2). The survey analyzed in this article revealed a high percentage of positive responses across all administrative performance areas. By carefully examining these responses, administrators can identify areas where the agency's limited resources can be most effectively allocated.

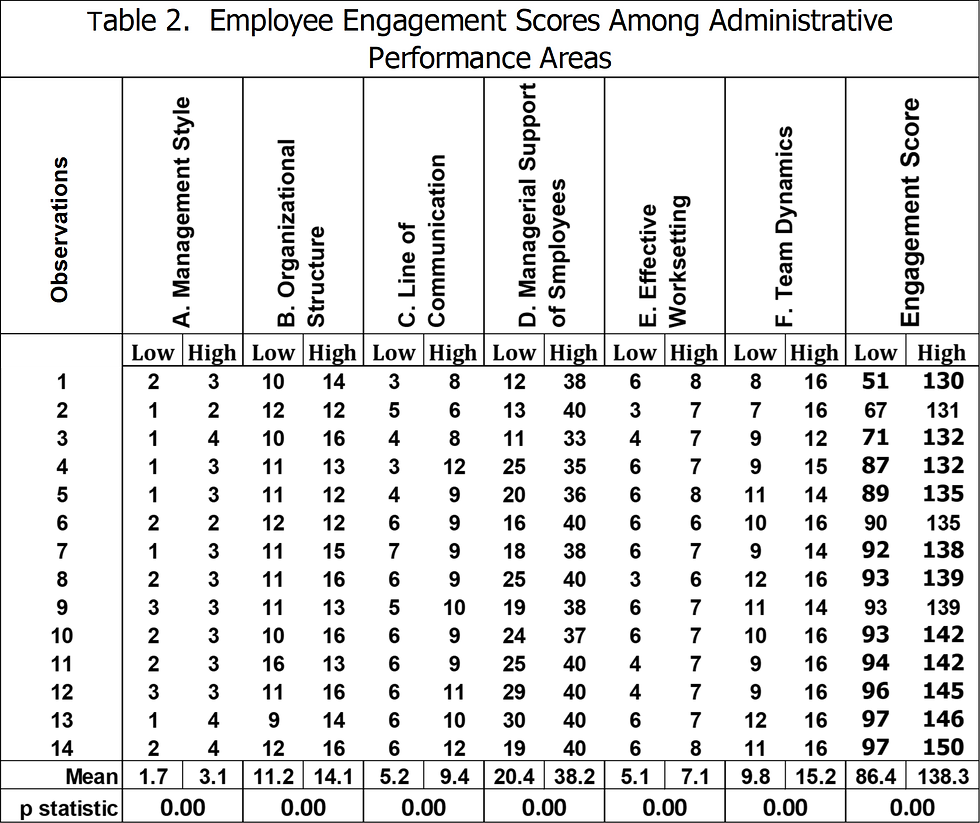
To assess respondent engagement with the agency's direction, we developed a scoring system based on their responses to the questionnaire. Scores ranged from 1 to 4, with higher scores indicating greater agreement. We then selected the 14 lowest and highest-scoring responses. As Table 2 demonstrates, there were statistically significant differences in scores between these two groups across all six performance areas.

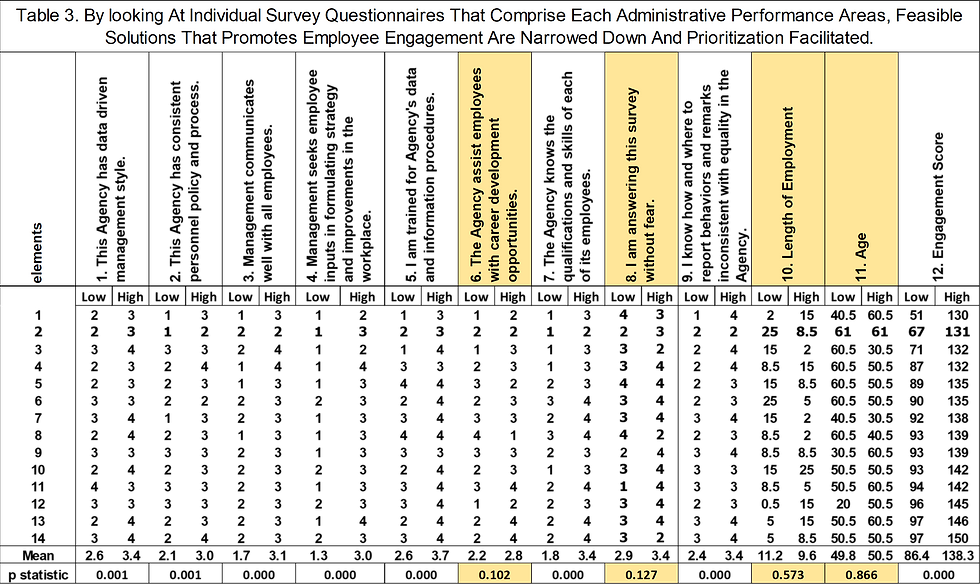
We next analyzed the score differences between the two groups for each of the 20 questionnaires. Table 3 presents four representative questionnaires (6, 8, 10, and 11) where the null hypothesis held. These results suggest that: a) personnel development was applied equitably, b) employees were not concerned about retaliation for negative feedback, and c) the workforce was diverse in terms of age and tenure.
A detailed analysis of the survey questionnaires revealed potential areas for process improvement. A more in-depth examination of these processes, guided by the high-level delivery process map in Figure 1, will be invaluable. For more information on process mapping, refer to reference (5). Based on our analysis, we suggest the following:
1. The administrator directly communicates the improved management style to employees at all levels of the organization. This is a departure from the common but ineffective practice of presenting such changes only to senior managers and expecting the message to be faithfully conveyed downward.
2. Effective communication of the new organizational structure to all employees is crucial. Currently, the agency is primarily organized into administrative programs. Direct-service employees, who constitute the majority of the workforce, are concentrated in a single program. The survey-recommended structure proposes the creation of vertically integrated work cells. These cells will incorporate direct-service employees, and program staff will be reassigned to support them.
3. In a traditional hierarchical organization, essential client and administrative information is often withheld from employees who directly interact with clients. The work cell model aims to enhance communication by eliminating this "trickle-down" effect. Work cells share program action plans with their members and receive operational feedback from direct contact workers. This two-way communication enables work cells to provide unified operational feedback to management.
4. Administration, in collaboration with human resources, will strive to cultivate a positive work environment that fosters optimal team dynamics and organizational performance.
______________________________________________________
Analytics
To assess employee engagement, we surveyed employees on seven management performance areas: management style, organizational structure, communication, guidance, work setting, team dynamics, and employee development. Respondents rated each area on a 4-point scale from "strongly agree" to "strongly disagree."
We developed a scoring system, assigning 4 points for "strongly agree," 1 point for "strongly disagree," and 0 points for no response. A perfect score would be 56, but most employees scored between 0 and 56. We selected 14 employees with the highest scores and 14 with the lowest scores for analysis.
To compare the highly engaged and least engaged groups, we aggregated their scores for each of the seven areas and the total engagement score. We then used ANOVA to determine if there were significant differences between these groups."

As shown above, highly engaged employees rated seven managerial performance areas more positively than their less engaged counterparts.
To identify specific areas of agreement, we selected nine questionnaires and two demographic statements for further analysis (Table 3). For each of these eleven items, we aggregated the scores of the 14 highly engaged employees and the 14 least engaged employees. We then used ANOVA to compare the scores between these two groups.

To illustrate our statistical analysis, consider the statement '6. The Agency assists employees with career development opportunities.' The average score for the less engaged group (2.2) was lower than that of the highly engaged group (2.8).
We tested the null hypothesis, which states that there is no difference in scores between the two groups. The alternative hypothesis is that there is a difference.
If the p-value is greater than 0.05, we accept the null hypothesis. If the p-value is less than or equal to 0.05, we accept the alternative hypothesis.
We entered the individual scores into Excel and used the ANOVA Single Factor tool to analyze them. The p-value in this case was 0.102, which is greater than 0.05. Therefore, we accepted the null hypothesis and concluded that there was insufficient evidence to reject it.
Except for the four questionnaires in Table 3, all others showed significant differences between the highly engaged and least engaged groups, supporting the alternative hypothesis.
By MgmtLaboratory.com staff. 2024
Editor’s Note: Administrators of non-profit organizations are encouraged to contact MgmtLaboratory.com for information on free on-line assistance to client satisfaction and/or employee engagement surveys. On-site consultation is available with our associate consultants on a cost-plus pricing agreement.
References
1. The Energy You Give Off Work Matters. www.hbr.org, September 2016.
2. Workplace and the Engaged Worker. www.mgmtlaboratory.com, December 2018.
3. ANOVA: An Easily Accessible Executive Analysis Tool. www.mgmtlaboratory.com, January 2018.
4. Performance Comparisons and Hypothesis Testing. www.mgmtlaboratory.com, October2021.
5. Process Mapping in Continuous Improvement of Public Services. www.mgmtlaboratory.com, June 2019.
6. Surveys with the purpose of obtaining responses to statements or questionnaires from an individual may be obtained by different conveyances. There are paper surveys, telephone surveys and online surveys.
7. Excel > Data > Data Analysis > Analysis Tools > Anova: Single Factor Analysis.
8. Minnesota Department of Human Services: A Case Study in Management Control Systems. www.mgmtlaboratory.com, October 2021.


Comments